Data · Click a point
Which lidar surveys cover this spot, and when were they flown?
Look up New York lidar survey dates for any spot: click the map and see every lidar survey in the USGS 3DEP index that covers it, newest first, with its collection dates, quality level and whether USGS publishes a lidar DEM from it there.
The outlines of those surveys are drawn on the map, darker where a place has been flown more than once. Free, like every tool on the map.
Free to run · pay to download
Free to run, and free to save as a PNG image of the map. This tool has no file export of its own. For the terrain as a file, Download Data exports contours, a GeoTIFF or a 3D mesh with a pass: US$29 for 24 hours, US$99 for 30 days or US$399 for 12 months.
Who uses this
- Engineers and surveyors. Check how recent the lidar behind a site is before relying on it.
- GIS analysts. Find the USGS project, its DEM files and its point cloud for a spot.
- Land buyers. See whether the terrain on a parcel comes from lidar at all.
When to use it
- Before relying on the terrain at a site: is it from a recent lidar survey, an older one, or no lidar at all?
- Finding out whether a place has been flown more than once, and when.
- Finding the USGS 3.3 ft lidar DEM files or the point cloud behind a spot, to download them yourself.
Tools for your job
Data Here is one step in a bigger question. These are the jobs it helps with, and the tools that go with it.
For the job: Plans, CAD, GIS and 3D printing
I need the terrain as a file.
- 1.Download Data — Contours, a GeoTIFF elevation model, a 3D DXF or LandXML ground surface, a georeferenced aerial photo or a 3D mesh for printing.
- 2.Data Here (this tool) — Which USGS lidar surveys cover a spot, when each was flown, and where to get its files.
- 3.Elevation Change — Where USGS lidar was flown twice: whether the ground has slid, been filled or been cut between the surveys, as a GeoTIFF.
- 4.Contour Lines — Contours previewed on the map before you export them.
- 5.Elevate a File — Adds ground elevation to your own GPX, KML, GeoJSON or CSV points.
- 6.Point Elevation — Spot elevations at the points you click or on a grid over a lot, as CSV, GeoJSON or DXF.
- 7.Terrain Stats — The highest, lowest and mean ground elevation of an area, and how the land is spread between them.
How to use it
- Open Data Here and click a spot on the map.
- Read the list: each survey shows its collection dates, quality level and DEM cell size, and whether USGS publishes its lidar DEM there. The outlines of those surveys are drawn on the map.
- Click somewhere else to check another spot.
Step by step: an Albany lot
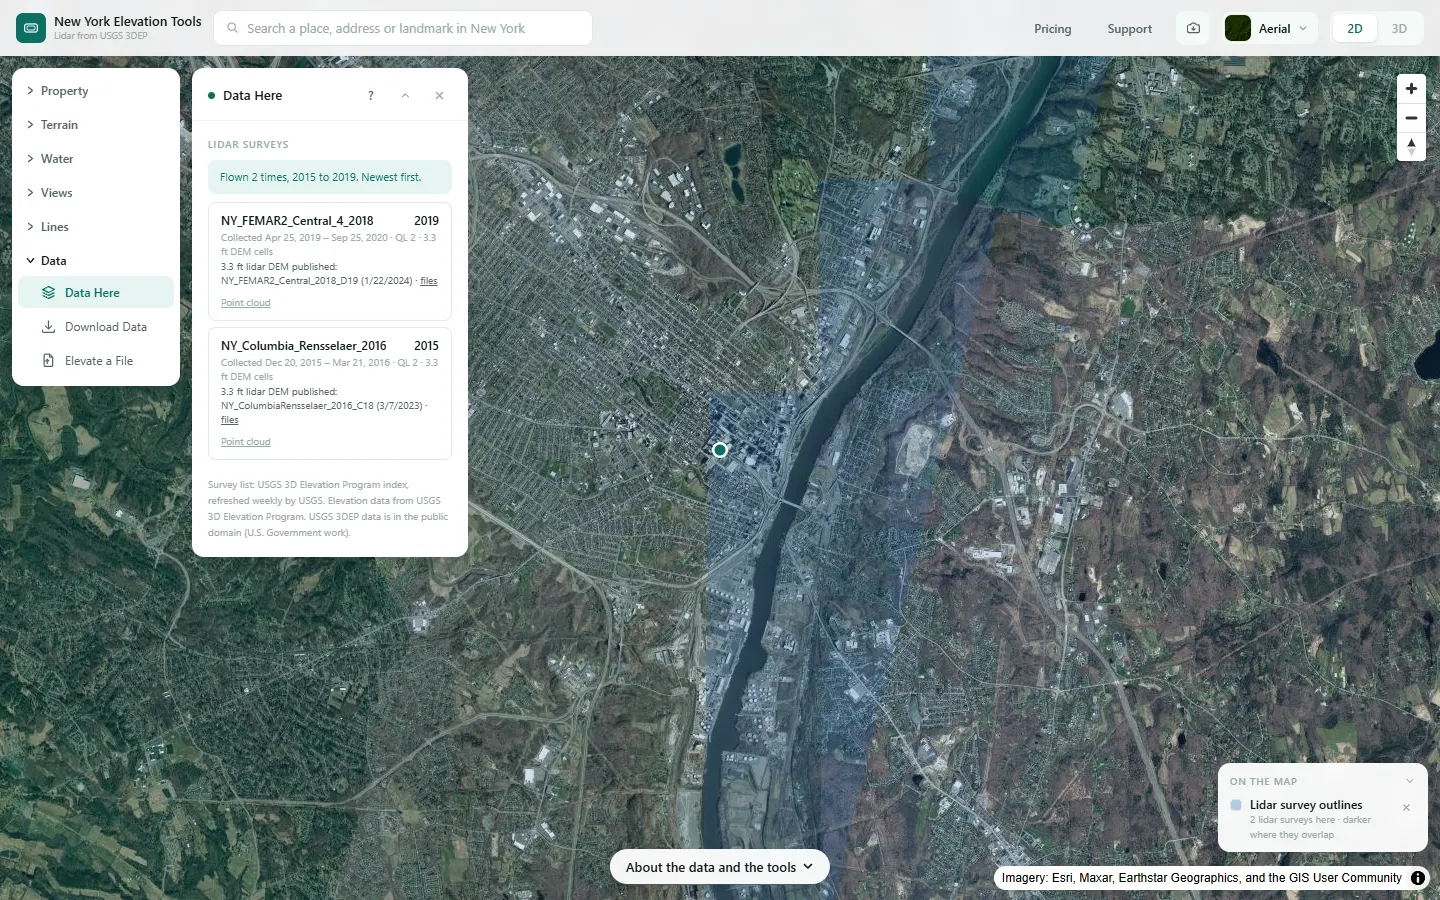
We check which lidar surveys cover a lot in downtown Albany, where USGS lists two surveys flown four years apart.
What it showed
- Where a place has been flown more than once, each survey is listed with its own collection dates and says whether USGS publishes its lidar DEM there, with a link to the files.
Screenshots from New York Elevation Tools. Imagery: Esri, Maxar, Earthstar Geographics, and the GIS User Community. Elevation data from USGS 3D Elevation Program. USGS 3DEP data is in the public domain (U.S. Government work).
How it works
The site asks the USGS 3DEP Elevation Index two questions about the point: which lidar work units cover it (their collection dates, quality level, DEM cell size and USGS’s rating against its 3.3 ft lidar DEM specification), and which published 3.3 ft lidar DEM projects cover it. The two are matched by project name. Every work unit is listed, including older surveys that do not meet the specification and surveys still pending publication; a survey the index holds twice under two names (Long Island 2014) is shown once, with the other name under it.
Collection dates come from the index, not from survey names: a survey named for one year can have been flown the next.
Reading the results
A survey with a published 3.3 ft lidar DEM links to its files. One rated “Does not meet” has no 3.3 ft lidar DEM; where it is the only survey, the map’s elevation there falls back to the coarser 1/3 arc-second model.
The outlines on the map overlap where a place has been flown more than once, and read darker there.
Limits and caveats
- Only surveys in the USGS 3DEP index are listed. Lidar held only by New York State or a county is not.
- Outlines on the map are simplified for drawing. Near the edge of a survey, trust the list rather than the drawing.
- If the USGS index does not answer, the panel says so and lists nothing; try again in a minute.
Data and attribution
Results come from the USGS 3D Elevation Program (3DEP) bare-earth elevation model: lidar at 3.3 ft per pixel where it has been flown, and the 1/3 arc-second model, about 33 ft per pixel, elsewhere, with elevations above NAVD 88. This edition uses bare-earth terrain only. Buildings and trees are excluded.
USGS 3DEP elevation and USGS maps are U.S. Government works in the public domain. Credit the USGS 3D Elevation Program. NYS public tax parcels are assessment data provided as is, not surveys. Esri World Imagery follows its own terms and is display-only; downloaded aerial imagery comes from USGS NAIP.
Questions
Where do the dates come from?
From the USGS 3DEP Elevation Index, which records each lidar work unit’s first and last collection day. Survey names are not used for dates: a survey named for one year can have been flown the next.
Why is an older survey listed with no lidar DEM?
USGS rates every survey against its 3.3 ft lidar DEM specification. Older surveys rated “Does not meet” are listed so you know they exist, but USGS publishes no 3.3 ft lidar DEM from them.
Can I download the files?
Where USGS publishes a 3.3 ft lidar DEM from a survey, the panel links to its folder of files, and to the point cloud where the index lists one. Those are USGS downloads, in the public domain.
Ready to try it?
Open Data Here on the map →Free to use, no account. The analysis runs in your browser on public-domain USGS 3DEP data. Downloading the results needs a pass: see pricing.
Missing something you need? Suggest a feature or ask about custom work.