See where water runs, gathers and sits on your farm
A farm runoff map for any field, pasture or farm in New York, traced from the USGS 3DEP lidar elevation model: the flow paths water takes across the ground, how many acres drain through each draw, the hollows where it sits after rain or snowmelt, which ground stays wet and how steep each slope is. Nothing to install and no account.
Use it to see where runoff concentrates before you walk the field, to look at the land uphill of your boundary that sends water onto it, and to take a map with the water on it to your county Soil and Water Conservation District or NRCS field office. You know where it runs after a storm; this shows how the pieces connect.
The workflow
Step 1 · Property
Load the farm boundary
The tax parcel as the working area, or up to 25 parcels at once, or a box drawn around one field. Results on the map are clipped to it.
Step 2 · Water & Drainage
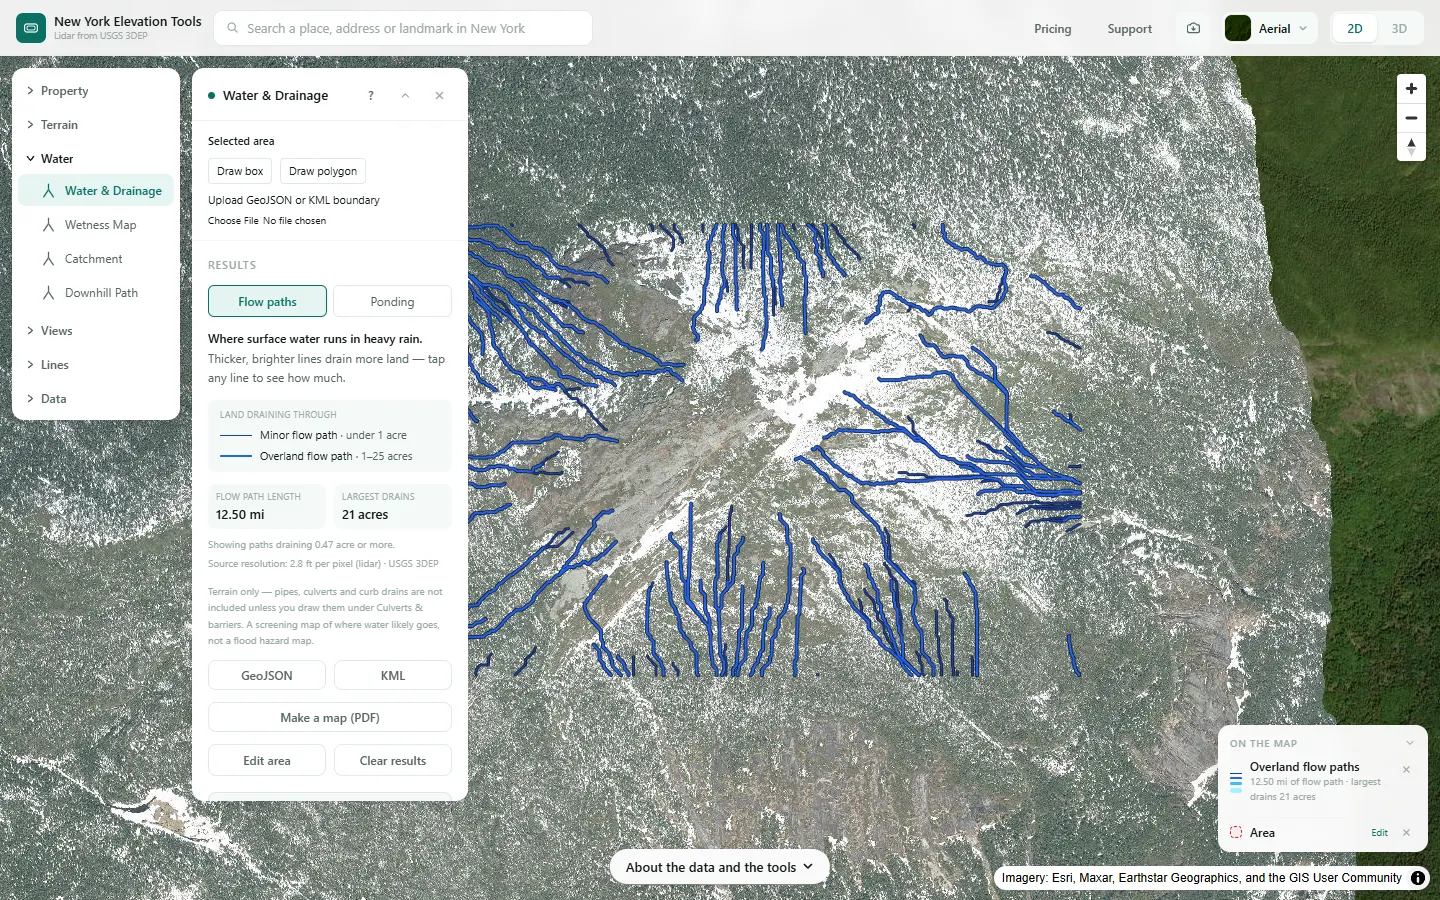
See where runoff gathers
Flow paths across the ground, each labeled with the acres of land draining through it, and a Ponding view of the low spots that would hold water, with depth, area and volume.
Step 3 · Downhill Path
Follow water from one spot
The line rain would run from a spot you click, such as a barnyard, a manure stack or the corner of a field, and how far it goes before it joins a water path or reaches a stream.
Step 4 · Catchment
See the land draining to a point
All the land upstream of a draw, a field corner or a stream crossing, in acres, including ground on the neighbor’s side of the fence and the road.
Step 5 · Wetness Map
Find the ground that stays wet
A map ranking the ground from dry ridges (tan) to the flats and hollows where the shape of the land concentrates water (blue).
Step 6 · Slope & Aspect
Read slope across the fields
Slope in degrees and percent for every part of the area, the share in each slope class, and how much is at any slope you type or steeper.
Step 7 · Point Elevation
Spot elevations for a tank, pump or ditch
The ground elevation in feet at up to 200 points you click, or on an even grid over a field.
Step 8 · Cut & Fill
Level a pad for a shop or barn
The cut and fill in cubic yards to level a pad at an elevation you set, or where the two balance.
Step 9 · Aerial History
Look back through old aerial photos
Every year of aerial photos NYS ITS Geospatial Services holds for a spot, 2000 to 2025, to swipe against today’s map: old lanes, filled ditches or a stream that has moved.
Step 10 · Elevation Change
Compare two lidar surveys
Where two surveys of the same ground exist, where it dropped or rose between them, with the volume of ground lost and gained.
Step 11 · Property Report
Take it to your planner
A PDF terrain report for the parcel, and a data ZIP with contours, a slope map, flow paths, a wetness map and an aerial photo. Parcel boundaries are not put in New York files.
Free to run · pay to download
See the full result on the map free, with no account. Download flow paths as GeoJSON or KML, catchment outlines as DXF, GeoJSON or KML, slope and wetness grids as GeoTIFF, spot elevations as CSV, and the property report and its data ZIP with a pass: US$29 for 24 hours, US$99 for 30 days or US$399 for 12 months, a one-off payment in US dollars that never renews. Every download on the site is included while the pass lasts.
What it doesn’t replace
- It maps where the ground sends water. It does not model erosion, sediment, nutrients, soil or how much rain it takes to start runoff.
- Tile drains, culverts, pipes and ditches narrower than the sampling are not in the terrain, so water is routed over the surface as if they were not there, unless you draw them under Culverts & barriers.
- It is not a conservation plan, a practice design or a wetland determination. New York’s Agricultural Environmental Management program is available to all farmers through their local Soil and Water Conservation District, and NRCS offers conservation technical assistance that helps producers identify conservation objectives and a roadmap for conservation on their operation.
- The ground is as the lidar recorded it; leveling, ditching and new tile lines put in since do not show. In New York, USGS publishes lidar DEMs from more than one survey of the same ground around Albany (flown 2015–2016 and 2019–2020), on Long Island (2014 and 2024), at Oswego (2014–2015, 2018 and 2023) and at Dunkirk (2014 and 2017). Most of the state has one such survey or none yet.
- A large farm can exceed a tool’s area limit. Run it a field or a pasture at a time.
Questions
Can it show where runoff concentrates in a field?
Yes, that is what the flow paths show: the draws and swales where water from the ground above joins up, labeled with the acres draining through each. NRCS’s Grassed Waterway standard (Code 412) applies where concentrated surface flow needs added capacity and vegetation to prevent erosion. Whether a practice fits a spot, and how it would be built, is a question for your Soil and Water Conservation District or NRCS field office, so take the maps to them.
Is this a conservation plan?
No. It is a set of terrain maps to bring to one: the boundary, the flow paths, the land draining to each draw, slope and wet ground. The plan, and any practice in it, comes from you and your planner.
Does it account for my tile drains and culverts?
Not unless you draw them. Under Culverts & barriers in Water & Drainage, Wetness Map and Catchment you can draw a culvert or drain the lidar can’t see, or a berm water has to go around. They are your assumption, and the results say when they were used.
Can several people use one pass?
A pass lives in the browser it was bought in, with no account. Anyone can run the tools for free; downloads work in the browser that holds the pass.
Guides
- Where Runoff Concentrates on New York Farm Fields
- Terrain Checks Before Buying Rural Land in New York
- Contour Map of Your New York Property
Data
Everything runs on the USGS 3D Elevation Program (3DEP) bare-earth elevation model: lidar at 3.3 ft per pixel where it has been flown, and the 1/3 arc-second model, about 33 ft per pixel, elsewhere. Every result says how much of the area came from that coarser model.
USGS 3DEP elevation and USGS maps are U.S. Government works in the public domain. Credit the USGS 3D Elevation Program. NYS public tax parcels are assessment data provided as is, not surveys. Esri World Imagery follows its own terms and is display-only; downloaded aerial imagery comes from USGS NAIP. Sample image: Elevation data from USGS 3D Elevation Program. USGS 3DEP data is in the public domain (U.S. Government work).